
Unity AI Complete Mastery Series
Part 1 — Unity AI Assistant Complete Beginner’s Guide: Ask, Plan & Agent Modes
Part 2 — Unity MCP Complete Guide: Connecting Claude Code, Codex, Gemini & Cursor to Unity Editor
Part 3 — Building Custom Unity MCP Tools: McpTool Deep Dive and 4 Registration Methods
Part 4 — Automating AI Workflows with the Unity Skills System: SKILL.md Complete Guide
Appendix — Unity MCP Built-in Tools Complete Reference: Parameters & Activation Guide for 51 Tools
Part 5 — Unity AI Assistant Project Overview Auto-Generation: Making AI Understand Your Project
Part 6 — Unity AI Assistant × Profiler: Diagnose Performance Bottlenecks in Plain Language (this post)
Unity Profiler is a powerful tool. But manually scrolling through timelines and interpreting numbers one by one takes more time and experience than you might expect. If you’ve ever spent an hour chasing a single frame spike, you know the feeling. Unity AI Assistant offers a way in — through natural language. Written based on Unity 6.3 (com.unity.ai.assistant 2.7).
TL;DR
– Assistant does not record Profiler data directly. You must capture a profiling session yourself.
– In the Assistant window, type a natural language question and Assistant automatically checks for available profiling data and presents analysis options.
– In the Profiler window, select a sample or frame, then click Ask Assistant — the data is attached automatically.
– This guide covers four data scenarios: saved session only, active session only, both, or neither.
– Analysis results appear in the Assistant window as a summary of timing patterns, memory behavior, and potential performance concerns.
Table of Contents
- My Project, Diagnosed by Unity AI
- Prerequisite — Assistant Does Not Record Data
- Entry Point 1 — Starting from the Assistant Window
- Four Data Scenario Branches
- Entry Point 2 — Starting from the Profiler Window
- Reading the Analysis Results
- FAQ
- Wrap-Up
- Related Posts
My Project, Diagnosed by Unity AI
Unity Profiler collects thousands of samples per second across dozens of modules — CPU, GPU, memory, rendering, physics, and more. The challenge is the sheer volume of data. You can usually spot which frame spiked, but pinpointing exactly why requires deep dives into the CPU timeline and call stack tracing.
Over more than 20 years of game development, I’d argue that debugging has consumed more of my time than writing code itself. Many of you will relate. More than half of performance issues come down to quickly identifying where to look. If you can shorten that initial context search with plain language, your diagnosis and resolution speed improves dramatically.
Unity AI Assistant’s Profiler integration targets exactly this point. Hand it Profiler data you’ve already captured, and Assistant summarizes timing patterns, memory behavior, and potential performance concerns. The AI handles the first pass through the complex timeline — so you can focus on what matters.
Prerequisite — Assistant Does Not Record Data
There’s something important to establish before we begin.
Assistant does not record profiling data. Capturing a profiling session is something you must do yourself from the Profiler window. Assistant can only analyze sessions that already exist — either saved or active.
This matters. If you ask “Why is my game slow?” without any Profiler data available, Assistant will guide you to the Profiler window via an Open Profiler option rather than providing an analysis. Data must exist first.
Prerequisites at a glance:
| Requirement | Details |
|---|---|
| Profiler data | At least one saved .data file or an active profiling session |
| Assistant active | Unity AI Assistant must be enabled in the Unity Editor |
Unity saves profiling sessions as .data files within the project. Open one of these, or keep an active session running, and you’re ready to start asking questions.
Entry Point 1 — Starting from the Assistant Window
You don’t need to open the Profiler first. Asking a performance-related question directly in the Assistant window is the first entry point.
Step-by-Step
Step 1: Open the Assistant window in Unity Editor.
Step 2: Type a performance-related question and submit. The official documentation suggests these example queries:
Why is my game running slowly?
What is causing high CPU usage in my project?
These questions trigger Assistant to start checking for available Profiler data. Similar natural language patterns work the same way.
Step 3: Assistant automatically checks for available profiling data and presents two options:
- Open Profiler — guides you to open the Profiler window
- Analyze — shown for available profiling sessions
Step 4: What happens next depends on what Profiler data exists in your project. This branching is the most important part of the workflow.
Four Data Scenario Branches
Assistant behaves differently depending on what Profiler data is available. There are four scenarios.
Here’s how Assistant responds in each scenario.
Scenario 1 — Saved Session Only
You have .data files from previous profiling work, but no active session is running.
Assistant displays the list of saved profiling sessions. Select Analyze next to the session you want, and Assistant will return a summary of timing patterns, memory behavior, and potential performance concerns.
Scenario 2 — Active Session Only
No saved sessions exist, but an active profiling session is open in the Profiler window.
In this case, Assistant automatically uses the active session. There’s no need to save it first. Results appear directly in the Assistant window.
Scenario 3 — Both Saved and Active Sessions
The most flexible situation. Assistant displays both saved and active sessions in a list. To analyze the active session, select Analyze next to that entry. Saving the session first is not required.
Scenario 4 — No Profiling Data
You haven’t run the Profiler yet, or there’s simply no data available when you ask.
Assistant explains that profiling data is required and presents the Open Profiler option. Select it to open the Profiler window, capture a session, then re-run your question to start the analysis. Unity stores profiling sessions as .data files within the project.
Entry Point 2 — Starting from the Profiler Window
If you’re already analyzing data in the Profiler window, there’s no need to open the Assistant separately. A second entry point lets you connect directly from within the Profiler.
This workflow is especially useful when you need focused explanation or optimization guidance for a specific frame or sample.
Step-by-Step
Step 1: Open the Profiler window in Unity Editor.
Step 2: Load a saved profiling session or record a new one.
Step 3: Switch to a supported view such as Timeline.
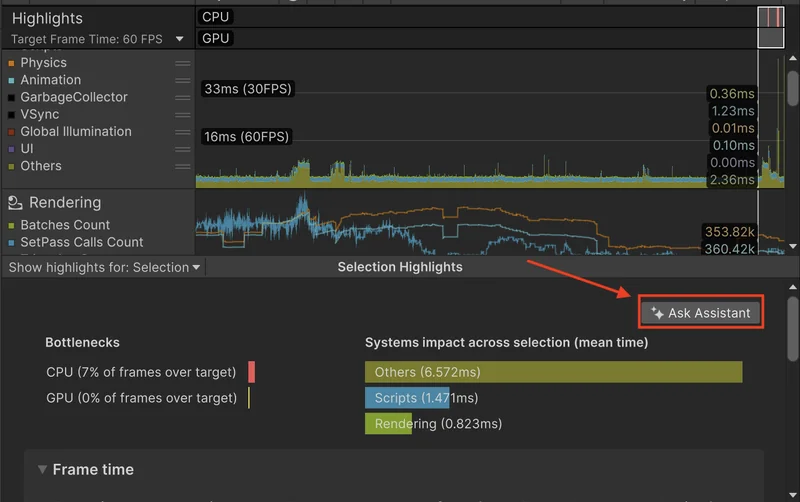
Step 4: Select the profiler sample or frame you want to analyze.
Step 5: Select Ask Assistant.
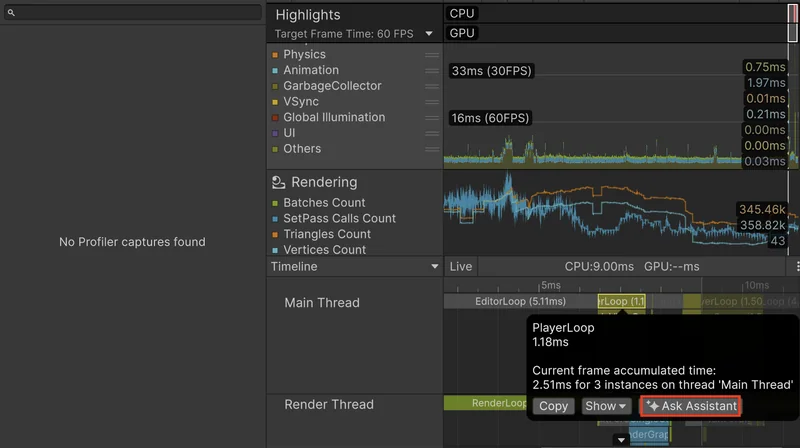
A prompt appears with an auto-suggested question based on your selection. You can edit this prompt before submitting. The selected profiling data is attached automatically.
Step 6: Submit the prompt. Analysis results appear in the Assistant window.
Step 7: Review the results, then select different samples or refine your questions to dig deeper into the performance issue.
Comparing the Two Entry Points
| Start from Assistant Window | Start from Profiler Window | |
|---|---|---|
| Starting point | Assistant window | Profiler window |
| Data selection | Assistant auto-detects and offers options | You select the sample or frame directly |
| Best for | Broad performance questions, before opening Profiler | Focused analysis of a specific sample or frame |
| Prompt | Written by you | Auto-suggested from selection, editable |
| Results displayed | Assistant window | Assistant window |
Both entry points use the same analysis pipeline. Results always appear in the Assistant window.
Reading the Analysis Results
Regardless of which entry point you use, results are displayed in the Assistant window in three categories.
| Category | Description |
|---|---|
| Timing Patterns | CPU time per frame, spike locations |
| Memory Behavior | Allocation/deallocation patterns, GC activity |
| Potential Performance Concerns | Warnings about patterns that may cause future issues |
Of the three, “Potential Performance Concerns” deserves particular attention. It flags patterns that could become problems as your project scales — even if your current frame rate looks fine. Making it a habit to check this section pays off later.
After receiving results, you can select different samples or refine your questions to continue exploring. Assistant maintains conversation context, so follow-up questions like “Which function had the largest GC Alloc in that result?” flow naturally.
Diagnose with Ask Mode, Fix with Agent Mode
While not explicitly stated in the official documentation, Profiler analysis structurally aligns with Ask mode. Ask mode specializes in read-only project inspection — querying data and returning results as text. Reading Profiler data and summarizing timing patterns, memory behavior, and performance concerns matches this characteristic exactly.
Understanding this reveals a practical workflow:
- Ask mode — Diagnose: Pass Profiler data and ask questions like “Which function has the most GC Alloc?” or “What’s causing the frame spike?” Assistant identifies the bottleneck.
- Agent mode — Fix: Once the cause is pinpointed, switch to Agent mode and request actual code changes: “Add object pooling to reduce GC Alloc.” Agent mode can modify your project directly.
Diagnose with Ask, fix with Agent. Using these two modes in sequence is, in my view, the most effective way to leverage Assistant for performance optimization.
Using Images and Screenshots
Beyond Profiler analysis, Assistant also supports submitting editor screenshots with your question. For example, when a pink material appears, you can capture the editor view and ask “Why is my cube pink?” — Assistant will analyze the image and diagnose issues like a missing shader or URP misconfiguration. Combining this with Profiler-based analysis creates a broader debugging workflow.
FAQ
Q. What happens if I ask about performance without any Profiler data?
A. Without data, Assistant provides general guidance or presents the Open Profiler option. Specific analysis tied to your actual project requires a Profiler session.
Q. Where are .data files stored?
A. Unity saves profiling sessions as .data files within the project. The exact path can be specified or confirmed through the save function in the Profiler window.
Q. Do I need to save the active session before analyzing it?
A. No. When both saved and active sessions exist, selecting Analyze next to the active session runs the analysis without saving first.
Q. Which Profiler views support Ask Assistant?
A. The official documentation specifies switching to a supported view such as Timeline before using this feature. Which additional views are supported is not explicitly documented.
Q. Does Profiler analysis consume Unity Credits?
A. Profiling data analysis through Assistant involves AI processing and may consume Unity Credits. Check Unity’s AI usage policy for specifics.
Wrap-Up
Unity AI Assistant’s Profiler integration is practically useful in two ways.
First, the barrier to entry is low. You don’t need to open the Profiler first — one question in the Assistant window starts the analysis. If no data exists, Assistant guides you to the Profiler. It fits naturally at any point in your workflow.
Second, you can delegate the first stage of timeline interpretation. When AI summarizes which of thousands of samples to look at first, you can focus on what matters: tracking the root cause and fixing it.
One thing to keep in mind: the quality of the analysis depends on the quality of the session. Feed Assistant a session that captures representative frame spikes — data from reproducible conditions — and the results become far more meaningful. Giving AI the right context is also a developer skill.
Related Posts
- Unity AI Assistant Ask, Plan, and Agent Mode — Complete Guide — Understand the differences between the three modes and how Ask mode’s read-only behavior makes it suitable for Profiler analysis.
- Unity 6 URP Render Graph Deep Dive Part 1 — Core Concepts — Understanding Render Graph structure helps you interpret the GPU rendering section of Profiler results more effectively.
← Previous: Part 5 — Unity AI Assistant Project Overview Auto-Generation: Making AI Understand Your Project